> ## Documentation Index
> Fetch the complete documentation index at: https://puzzlet-9ba7bb98.mintlify.site/llms.txt
> Use this file to discover all available pages before exploring further.
# Cost and token tracking
> Monitor LLM spending and token usage across your application
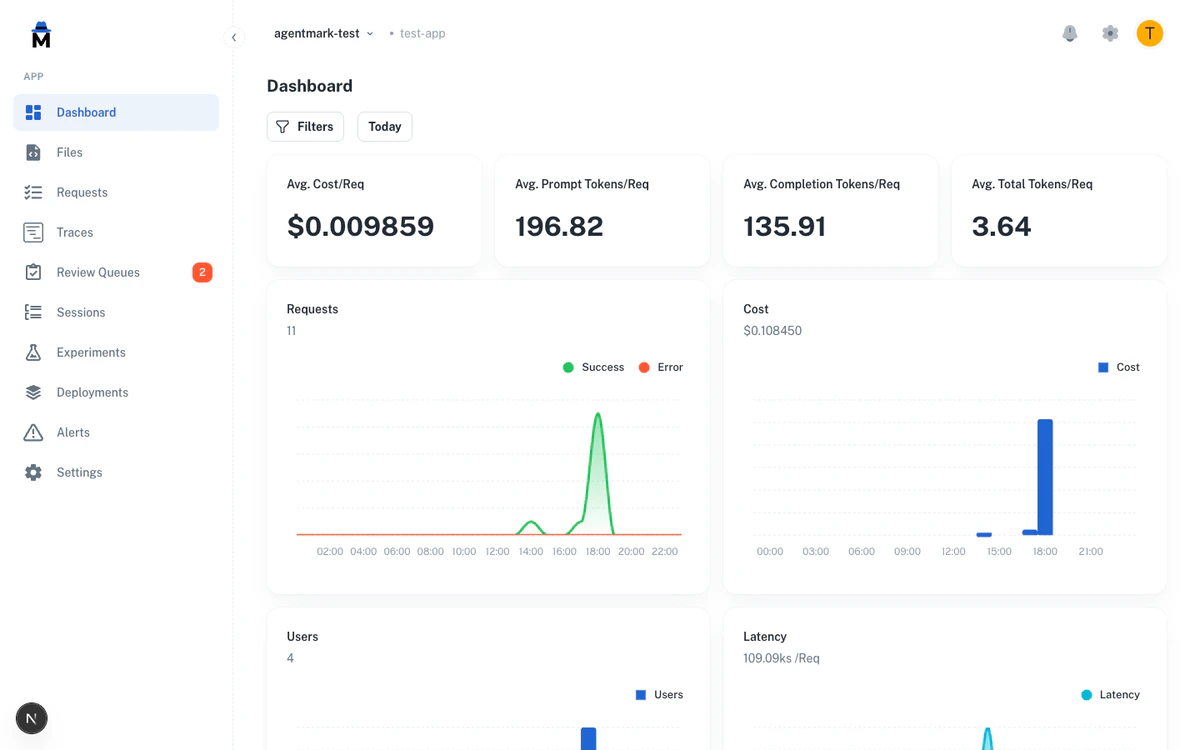
AgentMark automatically tracks costs and token usage for every LLM call. It calculates costs from token counts using provider pricing tables, and makes them available at the individual trace level and aggregated across your dashboards.
 Developers set up observability in your application. See [Observe overview](/observe/overview) for setup instructions.
## What AgentMark tracks
AgentMark records the following token and cost data for each LLM generation span. It tracks embedding spans the same way, so embedding calls appear in your cost totals and analytics breakdowns.
* **Input tokens** (prompt tokens): The number of tokens in the prompt sent to the model
* **Output tokens** (completion tokens): The number of tokens in the model's response
* **Total tokens**: The sum of input and output tokens
* **Reasoning tokens**: Additional tokens used by models that support chain-of-thought reasoning (such as OpenAI o1 and o3). These tokens represent the model's internal reasoning steps before producing a response.
* **Cost**: The dollar cost of the request, calculated from token counts and the model's pricing
The LLM provider's response reports token counts directly. AgentMark doesn't estimate token counts; it uses the exact values returned by the API.
## How AgentMark calculates costs
AgentMark computes cost automatically based on the model used and current provider pricing:
```text theme={null}
cost = (input_tokens × input_price_per_token) + (output_tokens × output_price_per_token)
```
Pricing comes from AgentMark's [model registry](https://github.com/agentmark-ai/agentmark/tree/main/packages/model-registry), which draws from LiteLLM and OpenRouter and refreshes at build time. AgentMark calculates costs at ingestion and stores them alongside each trace, so you always see accurate cost data without manual configuration.
For custom or self-hosted models not in the built-in pricing table, you can define pricing in your `agentmark.json` using model schemas. See [Custom model pricing](#custom-model-pricing) below.
## Supported providers
AgentMark's pricing table covers models from these providers:
* **OpenAI**: GPT-4.x, GPT-3.5, o1, o3, and variants
* **Anthropic**: Claude 4, Claude 3.x, and variants
* **Google**: Gemini 2.x and variants
* **Mistral**: Mistral Large, Medium, Small, and variants
* **Cohere**: Command R, Command R+, and variants
* **xAI**: Grok models
* **DeepSeek**: DeepSeek chat and reasoning models
* **Perplexity**: Sonar models
* **Groq**, **Fireworks AI**, **Together AI**: inference providers for open-weight models (including Llama variants)
* **AWS Bedrock**, **Azure OpenAI**: cloud-hosted variants of the above
AgentMark picks up new models and pricing updates automatically.
## Where to view cost data
### Dashboard metrics
The [Dashboards](/observe/dashboards) page shows aggregate cost data across your application:
* **Total cost** over your selected time range
* **Cost by model** to see which models drive your spending
* **Cost trends** over time to identify usage patterns
* **Average cost per request** to understand per-call economics
### Trace list
Each trace in the [Traces](/observe/traces-and-logs) list displays its cost and token counts. Use this to inspect individual requests and understand their resource consumption.
### Trace detail
When you open a trace, each generation span shows its own token breakdown:
* Input tokens, output tokens, and total tokens
* Reasoning tokens (when the model supports it)
* Cost for that specific LLM call
For traces with multiple LLM calls, the trace-level cost is the sum of all generation spans within it.
### Sessions
The [Sessions](/observe/sessions) view aggregates cost and token usage across all traces in a session. This is useful for understanding the total cost of multi-turn conversations or agent workflows.
### Per-user cost attribution
The Dashboard tracks cost and token usage per user when you attach a user ID to the trace. Pass it as a span option: `userId` in TypeScript (`span()`), `user_id` in Python (`span_context()`). Both write the trace's user field. You can also set it from a prompt by adding the reserved `user_id` key to [metadata](/observe/metadata). Use this for billing, capacity planning, or identifying heavy users. Filter traces by user ID in the [Filtering and search](/observe/filtering-and-search) view.
## Filtering by cost and tokens
You can filter traces by cost or token count using numeric operators in the filter bar. This helps you quickly find expensive or token-heavy requests.
**Available cost and token filters:**
* \*\*Cost ($)**: Filter traces where cost equals, exceeds, or falls below a threshold (for example, cost > $0.10)
* **Prompt tokens**: Filter by input token count
* **Completion tokens**: Filter by output token count
**Available operators for numeric filters:**
* `equals` / `notEquals`: Exact match
* `>` / `>=`: Greater than or greater than or equal
* `<` / `<=`: Less than or less than or equal
Combine cost filters with model or user filters to answer questions like "Which GPT-5 requests cost more than \$0.05?" or "Which users have the most expensive requests?"
## Aggregate analysis
On a dashboard, add or edit an operational widget and set a **Group by** dimension to compare cost and token usage:
* **Group by model** to compare cost efficiency across models
* **Group by user** to see per-user spending
* **Group by metadata key** (for example, `feature` or `environment`) to identify which flows drive cost
## Custom model pricing
For models not in the built-in pricing table (such as self-hosted models, fine-tuned models, or newer providers), you can define custom pricing in your `agentmark.json` using model schemas:
```json theme={null}
{
"modelSchemas": {
"my-fine-tuned-model": {
"label": "My Fine-Tuned GPT-5",
"cost": {
"inputCost": 0.005,
"outputCost": 0.015,
"unitScale": 1000
}
}
}
}
```
| Property | Description |
| ------------ | ---------------------------------------------------------------------------------------------------- |
| `inputCost` | Cost per unit for input tokens |
| `outputCost` | Cost per unit for output tokens |
| `unitScale` | Number of tokens per unit (for example, `1000` = cost per 1K tokens, `1000000` = cost per 1M tokens) |
AgentMark applies custom model pricing at ingestion time, the same as built-in pricing. It always tracks token counts whether or not you set pricing.
For full details on model schema configuration, see [Adding models](/configure/model-schemas).
## Best practices
**Monitor cost trends regularly.** Check your Dashboard to spot unexpected cost increases early. A sudden spike may indicate a prompt regression or unexpected traffic.
**Use cost filters to find expensive requests.** Filter traces where cost exceeds your expected per-request budget. Investigate high-cost traces to see whether you can optimize their prompts.
**Track per-user costs for billing.** If you bill customers based on AI usage, filter traces by `user_id` to pull per-user attribution data.
**Compare model costs.** Add a dashboard widget grouped by model to evaluate whether cheaper models can handle certain tasks without quality loss.
**Set up alerts for cost thresholds.** Configure [Alerts](/observe/alerts) to notify you when cost metrics exceed acceptable levels.
## Next steps
View aggregate cost and usage metrics
Inspect individual request costs
Get notified of cost spikes
Filter traces by cost and tokens
Developers set up observability in your application. See [Observe overview](/observe/overview) for setup instructions.
## What AgentMark tracks
AgentMark records the following token and cost data for each LLM generation span. It tracks embedding spans the same way, so embedding calls appear in your cost totals and analytics breakdowns.
* **Input tokens** (prompt tokens): The number of tokens in the prompt sent to the model
* **Output tokens** (completion tokens): The number of tokens in the model's response
* **Total tokens**: The sum of input and output tokens
* **Reasoning tokens**: Additional tokens used by models that support chain-of-thought reasoning (such as OpenAI o1 and o3). These tokens represent the model's internal reasoning steps before producing a response.
* **Cost**: The dollar cost of the request, calculated from token counts and the model's pricing
The LLM provider's response reports token counts directly. AgentMark doesn't estimate token counts; it uses the exact values returned by the API.
## How AgentMark calculates costs
AgentMark computes cost automatically based on the model used and current provider pricing:
```text theme={null}
cost = (input_tokens × input_price_per_token) + (output_tokens × output_price_per_token)
```
Pricing comes from AgentMark's [model registry](https://github.com/agentmark-ai/agentmark/tree/main/packages/model-registry), which draws from LiteLLM and OpenRouter and refreshes at build time. AgentMark calculates costs at ingestion and stores them alongside each trace, so you always see accurate cost data without manual configuration.
For custom or self-hosted models not in the built-in pricing table, you can define pricing in your `agentmark.json` using model schemas. See [Custom model pricing](#custom-model-pricing) below.
## Supported providers
AgentMark's pricing table covers models from these providers:
* **OpenAI**: GPT-4.x, GPT-3.5, o1, o3, and variants
* **Anthropic**: Claude 4, Claude 3.x, and variants
* **Google**: Gemini 2.x and variants
* **Mistral**: Mistral Large, Medium, Small, and variants
* **Cohere**: Command R, Command R+, and variants
* **xAI**: Grok models
* **DeepSeek**: DeepSeek chat and reasoning models
* **Perplexity**: Sonar models
* **Groq**, **Fireworks AI**, **Together AI**: inference providers for open-weight models (including Llama variants)
* **AWS Bedrock**, **Azure OpenAI**: cloud-hosted variants of the above
AgentMark picks up new models and pricing updates automatically.
## Where to view cost data
### Dashboard metrics
The [Dashboards](/observe/dashboards) page shows aggregate cost data across your application:
* **Total cost** over your selected time range
* **Cost by model** to see which models drive your spending
* **Cost trends** over time to identify usage patterns
* **Average cost per request** to understand per-call economics
### Trace list
Each trace in the [Traces](/observe/traces-and-logs) list displays its cost and token counts. Use this to inspect individual requests and understand their resource consumption.
### Trace detail
When you open a trace, each generation span shows its own token breakdown:
* Input tokens, output tokens, and total tokens
* Reasoning tokens (when the model supports it)
* Cost for that specific LLM call
For traces with multiple LLM calls, the trace-level cost is the sum of all generation spans within it.
### Sessions
The [Sessions](/observe/sessions) view aggregates cost and token usage across all traces in a session. This is useful for understanding the total cost of multi-turn conversations or agent workflows.
### Per-user cost attribution
The Dashboard tracks cost and token usage per user when you attach a user ID to the trace. Pass it as a span option: `userId` in TypeScript (`span()`), `user_id` in Python (`span_context()`). Both write the trace's user field. You can also set it from a prompt by adding the reserved `user_id` key to [metadata](/observe/metadata). Use this for billing, capacity planning, or identifying heavy users. Filter traces by user ID in the [Filtering and search](/observe/filtering-and-search) view.
## Filtering by cost and tokens
You can filter traces by cost or token count using numeric operators in the filter bar. This helps you quickly find expensive or token-heavy requests.
**Available cost and token filters:**
* \*\*Cost ($)**: Filter traces where cost equals, exceeds, or falls below a threshold (for example, cost > $0.10)
* **Prompt tokens**: Filter by input token count
* **Completion tokens**: Filter by output token count
**Available operators for numeric filters:**
* `equals` / `notEquals`: Exact match
* `>` / `>=`: Greater than or greater than or equal
* `<` / `<=`: Less than or less than or equal
Combine cost filters with model or user filters to answer questions like "Which GPT-5 requests cost more than \$0.05?" or "Which users have the most expensive requests?"
## Aggregate analysis
On a dashboard, add or edit an operational widget and set a **Group by** dimension to compare cost and token usage:
* **Group by model** to compare cost efficiency across models
* **Group by user** to see per-user spending
* **Group by metadata key** (for example, `feature` or `environment`) to identify which flows drive cost
## Custom model pricing
For models not in the built-in pricing table (such as self-hosted models, fine-tuned models, or newer providers), you can define custom pricing in your `agentmark.json` using model schemas:
```json theme={null}
{
"modelSchemas": {
"my-fine-tuned-model": {
"label": "My Fine-Tuned GPT-5",
"cost": {
"inputCost": 0.005,
"outputCost": 0.015,
"unitScale": 1000
}
}
}
}
```
| Property | Description |
| ------------ | ---------------------------------------------------------------------------------------------------- |
| `inputCost` | Cost per unit for input tokens |
| `outputCost` | Cost per unit for output tokens |
| `unitScale` | Number of tokens per unit (for example, `1000` = cost per 1K tokens, `1000000` = cost per 1M tokens) |
AgentMark applies custom model pricing at ingestion time, the same as built-in pricing. It always tracks token counts whether or not you set pricing.
For full details on model schema configuration, see [Adding models](/configure/model-schemas).
## Best practices
**Monitor cost trends regularly.** Check your Dashboard to spot unexpected cost increases early. A sudden spike may indicate a prompt regression or unexpected traffic.
**Use cost filters to find expensive requests.** Filter traces where cost exceeds your expected per-request budget. Investigate high-cost traces to see whether you can optimize their prompts.
**Track per-user costs for billing.** If you bill customers based on AI usage, filter traces by `user_id` to pull per-user attribution data.
**Compare model costs.** Add a dashboard widget grouped by model to evaluate whether cheaper models can handle certain tasks without quality loss.
**Set up alerts for cost thresholds.** Configure [Alerts](/observe/alerts) to notify you when cost metrics exceed acceptable levels.
## Next steps
View aggregate cost and usage metrics
Inspect individual request costs
Get notified of cost spikes
Filter traces by cost and tokens
Have questions?
Reach out any time: